

TL;DR:
- Understanding solar ROI involves evaluating total lifetime savings relative to system costs, influenced by location, utility rates, and incentives. Accurate calculation requires factoring in panel degradation, export credit policies, and detailed cash flow models to avoid overestimating returns. Ultimately, despite longer payback periods after the federal tax credit expiration, well-informed homeowners can still achieve significant positive long-term returns.
If you’ve been quoted a solar system price and wondered whether the numbers actually work in your favor, you’re already asking the right question. Understanding what is solar ROI — or return on investment — is the key to making a confident decision, not just a hopeful one. ROI isn’t a single guaranteed number. It shifts based on where you live, what your utility charges, how much power you use, and what incentives are still available. This guide breaks down exactly how solar ROI works, what affects it, and how to calculate it for your specific situation.
Key takeaways
| Point | Details |
|---|---|
| Solar ROI vs. payback period | ROI measures total lifetime return; payback period only tells you when you break even. |
| Formula to know | [Lifetime net savings ÷ net system cost] × 100 gives you your solar ROI percentage. |
| Location changes everything | Hawaii averages a 5-year payback; Washington state can stretch to 20 years or more. |
| Federal tax credit is gone | The residential clean energy credit expired December 31, 2025, making state incentives more important than ever. |
| Net metering matters | Export credit rates can shift your ROI by 20 to 30%, so always confirm your utility’s policy before buying. |
What is solar ROI and how to calculate it
Solar ROI is the formal way to measure your solar investment return as a percentage of what you spent. The industry term you’ll see in financial analysis is “return on investment,” expressed over the full life of the system, typically 25 years.
The core solar ROI formula is:
Solar ROI (%) = (Lifetime Net Savings ÷ Net System Cost) × 100
Here’s what each piece actually means:
- Lifetime net savings — the total amount you avoid paying your utility over the system’s life, plus any export credits you earn for sending power back to the grid, minus maintenance costs over that period.
- Net system cost — your total installation cost after subtracting any state or local incentives and rebates. If you financed the system, add the total interest paid to this figure.
- Divide and multiply — divide your lifetime net savings by the net system cost, then multiply by 100 to express it as a percentage.
A quick example: Say your system costs $20,000 installed, you receive $2,000 in state rebates, and your net cost is $18,000. Over 25 years, you project $45,000 in electricity savings and export credits, minus $1,500 in maintenance. Your lifetime net savings = $43,500. Your solar ROI = ($43,500 ÷ $18,000) × 100 = 241%.
That sounds impressive, and it can be. But it depends heavily on the inputs you use.
Payback period is a different, simpler calculation. It answers the question: when do I get my money back? Divide your net system cost by your average annual savings. A $18,000 system saving $1,800 per year has a 10-year payback. Payback period vs. ROI serve different purposes: payback tells you when you break even, while ROI tells you the total reward for staying in the investment long term.
One factor most homeowners underestimate: panel degradation. Solar panels lose roughly 0.5% of their output efficiency each year. Over 25 years, that adds up. Ignoring degradation can overstate your lifetime savings by 5 to 10%, which is enough to meaningfully shift the math in tight cases.
Pro Tip: When you get a solar quote, ask the installer to show you the year-by-year cash flow projection, not just total savings. A proper solar ROI model factors in panel degradation, rate escalation, and export credit schedules annually, giving you a far more reliable number.
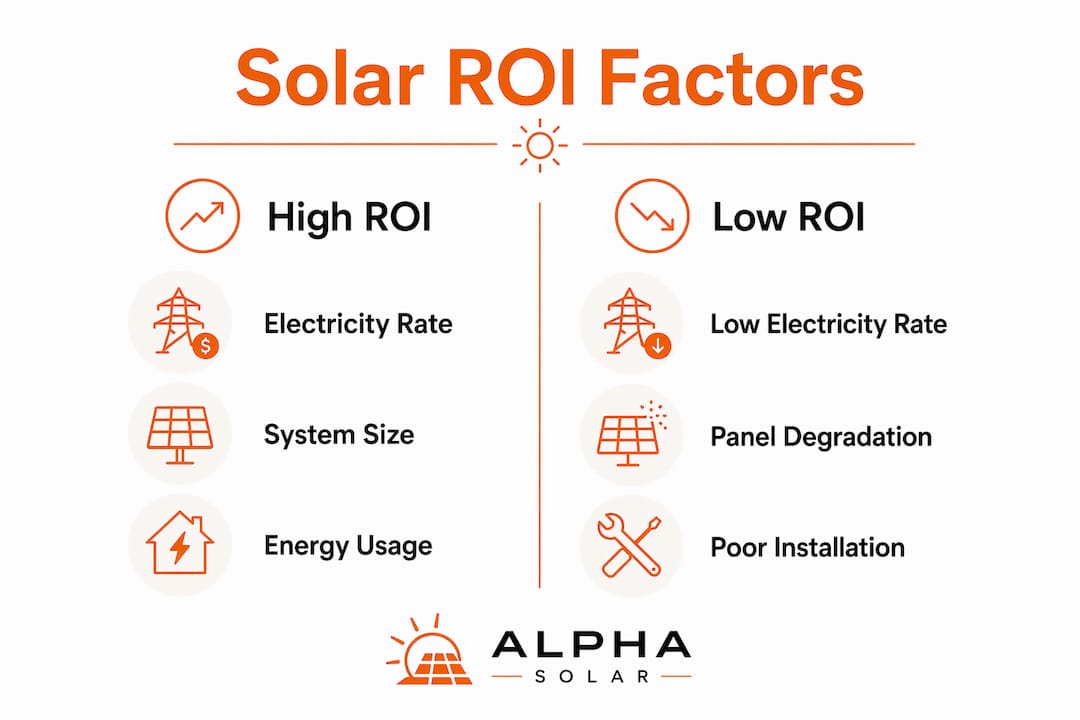
Factors that shape your solar ROI
Not everyone gets the same return on solar. Here’s what actually moves the needle:
- Local electricity rates. The higher your utility charges per kilowatt-hour, the more you save each year. Homeowners in states like Hawaii and California, where rates are significantly above the national average, see faster paybacks and higher overall returns.
- Sun exposure. More direct sunlight hours mean more power produced. Texas and Arizona naturally have an advantage over northern states like Washington or Minnesota.
- System size and panel quality. Larger systems generate more savings, but they also cost more upfront. Higher-efficiency panels cost more per watt but produce more power in a given roof space, which matters if your roof area is limited.
- Electricity usage patterns. If your household uses most of its power during daylight hours, you consume more of what your panels produce directly. That maximizes your savings versus exporting power to the grid.
- Net metering and export credit rates. When your panels produce more than you use, the excess flows back to the grid. Your utility credits you for that power, but the credit rate matters enormously. Policies like California’s NEM 3.0 have reduced export credit rates, and changes in export credit rules can reduce effective ROI by as much as 20 to 30%. Always check your utility’s current net metering policy before signing a contract. You can learn more about how these policies work through Alphasolarsa’s net metering resources.
- Incentives still available. The federal residential clean energy credit expired on December 31, 2025. That changes the financial picture for 2026 installations. State rebates, property tax exemptions, and utility-specific programs now carry more weight. Check what your state and local utility offer before you calculate.
| Factor | High ROI impact | Low ROI impact |
|---|---|---|
| Electricity rate | Above $0.15/kWh | Below $0.10/kWh |
| Sun hours per day | 5+ hours | Under 3.5 hours |
| Net metering policy | Retail-rate credit | Reduced or no credit |
| State incentives | Strong rebates available | None beyond federal (expired) |
| Financing | Paid cash or low-rate loan | High-interest loan |
Pro Tip: Your electricity rate escalation assumption matters more than most people realize. If rates rise 3% per year, your future savings grow accordingly. Ask your installer what rate escalation they’re assuming — accurate ROI modeling should always include this.
Typical solar ROI outcomes by region in 2026
With the federal tax credit no longer available, payback periods in 2026 are generally longer than they were in prior years. That said, many states still offer compelling returns.
Residential solar payback periods across the U.S. typically range from 6 to 12 years, though this stretches beyond 15 years in low-rate, low-sun states. Annualized ROI across the full system life runs from 8% to 20% in most markets, or roughly 150 to 300% over 25 years.
Here’s how regional differences look in practice:
| Region | Avg. payback period | Estimated 25-year ROI | Key driver |
|---|---|---|---|
| Hawaii | ~5 years | ~300%+ | Extremely high electricity rates |
| California | ~7 to 9 years | ~200 to 250% | High rates, strong sun |
| Texas | ~9 to 11 years | ~150 to 180% | High sun, moderate rates |
| Florida | ~9 to 11 years | ~150 to 175% | Good sun, moderate rates |
| New York | ~10 to 12 years | ~140 to 175% | Strong state incentives |
| Washington state | ~15 to 20 years | ~50 to 80% | Low rates, limited sun |
One comparison that surprises many homeowners: solar investment yields averaging 8 to 20% annually, and those returns come as electricity savings rather than taxable income. The S&P 500 has historically averaged around 10% annually before taxes. Solar’s risk profile is also different. Stock returns fluctuate. Your electricity bill savings are predictable once the system is installed and performing as designed.
For states like Texas, where Alphasolarsa operates, the math still works positively in most cases. Understanding your solar payback in Texas in detail can help you set realistic expectations from the start.
Common mistakes that skew solar ROI projections
Getting the math wrong doesn’t just lead to disappointment. It can lead to a financial commitment that doesn’t perform as promised. Here are the most common errors to watch for:
- Leaving out financing costs. If you take a solar loan, the total interest paid can add thousands to your net system cost. That interest must be included in your calculation, not ignored.
- Forgetting panel degradation. As mentioned earlier, a system producing 10% less power by year 20 is not delivering the same savings. Models that assume flat output for 25 years overstate returns.
- Assuming static electricity rates. Utilities raise rates over time. Assuming your current rate never changes leads to a conservative savings estimate in most cases, though your installer should be transparent about what rate growth they’ve modeled.
- Ignoring export credit changes. Exporting power at less than retail rate materially reduces returns if your system is sized to export significant power. Know your utility’s export credit rate before you size the system.
- Not accounting for shading. A tree that partially shades your roof in afternoon hours can meaningfully reduce output. A good installer should conduct a proper shading analysis using tools like PVWatts.
- Comparing quotes on different assumptions. One installer might quote a 25-year system life; another might use 20 years. One might assume 3% annual rate escalation; another might assume 0%. When you compare installer proposals, confirm that all key assumptions are consistent before deciding which quote offers better value.
Pro Tip: Treat your solar investment like a cash-flow problem, not a simple ratio. Ask for a year-by-year savings table that shows when your system breaks even, what your net savings look like in year 10 and year 20, and what assumptions drive those numbers. Transparency in the model is a sign of a trustworthy installer.
Using solar ROI to make your decision
Once you understand the concept, here’s how to put it to work for your specific situation:
- Gather your actual electricity data. Pull 12 months of utility bills and note your average monthly usage in kilowatt-hours and your average rate per kilowatt-hour. This is the foundation of any real solar ROI estimate.
- Get multiple quotes with transparent assumptions. Ask each installer to show you the net system cost after all incentives, the projected annual production, the degradation rate they’re using, and whether their savings estimate includes export credits and at what rate.
- Use both ROI and payback period together. Payback tells you your risk window. ROI tells you the total reward. A 10-year payback with a 200% ROI is a very different investment from a 10-year payback with a 90% ROI over the same system life.
- Factor in your plans for the property. If you’re in your home for at least 8 to 10 more years, you benefit directly from the savings. If you’re selling sooner, you’ll want to understand how solar affects your home’s resale value, which studies consistently show is positive.
- Run your numbers in a verified calculator. Tools that incorporate your specific inputs, including rate structure, usage patterns, and local net metering policy, give you a more personalized picture than any national average. Alphasolarsa’s guidance on maximizing your solar return walks through this process in detail.
- Consult a local expert. A local installer familiar with your utility’s rate structure and export credit policies will build a more accurate model than an online tool used without local knowledge.
My honest take on solar ROI in 2026
I’ve worked with enough homeowners and property investors to know that solar ROI is one of the most misunderstood concepts in the energy space. People either expect a guaranteed windfall or write it off entirely because the upfront cost feels large. Neither reaction serves you well.
What I’ve learned is this: the numbers are real, but only if the inputs are honest. The single biggest mistake I see is homeowners accepting an ROI projection at face value without asking what assumptions are underneath it. A beautiful 12-year payback estimate built on a 5% annual rate escalation assumption and full retail export credit looks a lot worse if your utility changes its net metering policy next year.
The expiration of the federal tax credit has genuinely shifted the timeline. Systems that would have paid back in 7 years with the credit may now project closer to 9 or 10. That’s still a strong return in most cases, but it means doing the math carefully rather than relying on projections from two years ago.
My strong advice: treat ROI as a living estimate, not a fixed promise. Run scenarios. What does the ROI look like if rates rise 2% per year instead of 4%? What happens if your utility reduces export credits? Understanding export credit sensitivity is not pessimism. It’s how serious investors protect themselves.
Solar is still one of the best long-term financial moves many homeowners can make. Get the model right, and it speaks for itself.
— Anthony
See what solar can do for your home
If you’ve made it this far, you now have a clearer picture of solar ROI than most homeowners who sign a contract. The next step is turning that understanding into a real number for your home.
At Alphasolarsa, we build custom solar systems for San Antonio homeowners based on your actual electricity usage, roof design, and local utility policies. We’re not guessing at your ROI. We model it. Our team covers residential solar installation from the first site assessment through activation, plus battery storage, EV charger installation, and panel cleaning to keep your system performing for decades. We also handle commercial solar for property investors evaluating commercial solar options. Get a personalized ROI assessment from a local expert who knows San Antonio’s grid, utility rates, and incentive landscape.
FAQ
What does solar ROI actually measure?
Solar ROI measures the total financial return of your solar system as a percentage of what you paid for it, calculated as lifetime net savings divided by net system cost, multiplied by 100.
How is solar ROI different from payback period?
Payback period tells you when you recover your upfront cost. ROI tells you the total return over the system’s full life. A system can pay back in 9 years but still deliver 200% ROI over 25 years.
Is solar ROI still worth it without the federal tax credit?
Yes, in most markets. Payback periods are longer without the federal credit that ended December 31, 2025, but homeowners in states with higher electricity rates and good sun exposure still see strong positive returns.
What is a good solar ROI?
An annualized ROI of 8 to 20% is typical for U.S. homeowners in 2026, depending on location, electricity rates, and system design. Over 25 years, that translates to roughly 150 to 300% total return.
What is the biggest factor in calculating solar ROI accurately?
Net metering policy and export credit rates have one of the largest impacts on ROI accuracy. Assuming full retail credit when your utility pays a reduced rate can overstate your returns by 20 to 30%.