
TL;DR:
- Solar system monitoring detects efficiency losses from faults, shading, and dust before visible signs appear.
- Monitoring improves system longevity, maximizes savings, and provides proof for warranties and incentives.
- Regular checks of performance ratio and system data help homeowners catch issues early and optimize their investment.
Most San Antonio homeowners celebrate the day their solar panels go live. The meter runs backward, the electric bill drops, and it feels like the hard part is over. But here’s what many people don’t realize: solar panels can quietly lose efficiency for months before you notice anything on your bill. A faulty inverter, partial shading from a neighbor’s new tree, or dust buildup can cost you hundreds of dollars in lost energy production without triggering a single visible warning. Solar system monitoring is the tool that keeps this from happening, and it’s one of the most overlooked parts of owning a solar system.
Table of Contents
- Understanding solar system monitoring
- Why monitoring matters for San Antonio homeowners
- Common metrics and what they reveal
- Monitoring options: From DIY to pro solutions
- Why proactive monitoring is non-negotiable for solar owners
- Ready to optimize your solar investment?
- Frequently asked questions
Key Takeaways
| Point | Details |
|---|---|
| Continuous oversight pays | Active solar system monitoring helps identify and resolve performance issues quickly. |
| Performance ratio reveals health | A high PR means your system is efficient, while drops can signal problems. |
| Save more with quick fixes | Catching inefficiencies early means more long-term savings and a better return on your solar investment. |
| DIY vs. pro monitoring | Both approaches have advantages, but pro solutions often catch issues homeowners miss. |
Understanding solar system monitoring
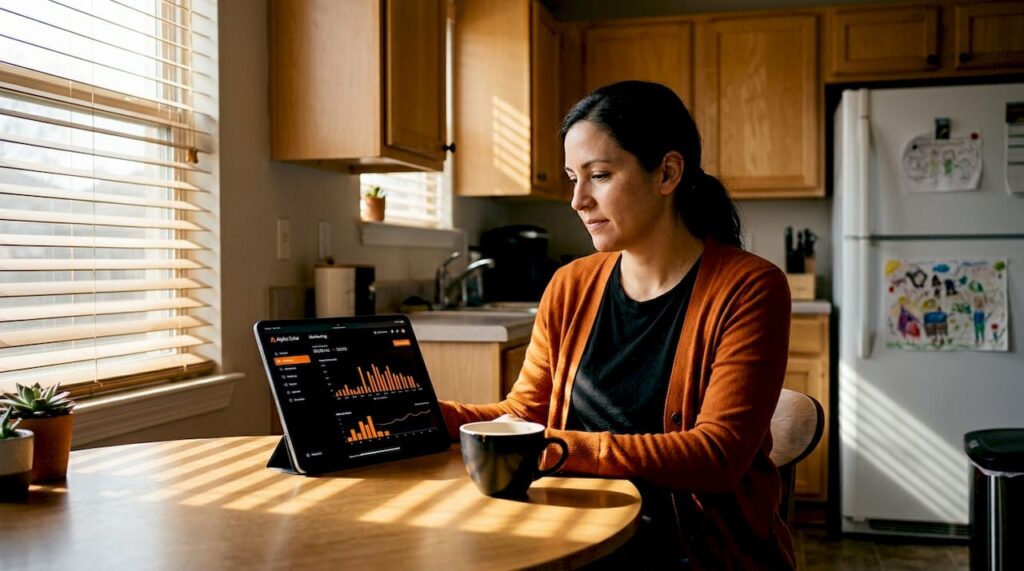
Solar system monitoring is exactly what the name suggests. It’s a way to watch your solar system in real time and over time, so you always know how much energy you’re producing, how well your equipment is working, and whether anything needs attention. Think of it as a health tracker for your solar investment.
Before diving into our solar guide or reviewing the solar pros and cons, it helps to understand the four core pieces that make monitoring work:
- Sensors: Measure sunlight levels and temperature at the panel surface
- Inverters: Convert solar energy from direct current (DC) to alternating current (AC) and report data on how much power is being generated
- Meters: Track both the energy your system produces and how much you pull from the utility grid
- Software dashboards: Pull all that data together in an app or web portal where you can see it clearly
As a homeowner, your monitoring dashboard can show you:
- ⚡ Daily, monthly, and annual energy production in kilowatt hours (kWh)
- 📊 Real-time power output from each panel or string of panels
- 🔔 Alerts for faults, errors, or underperforming equipment
- 🌤️ Weather-adjusted performance comparisons
- 💰 Estimated savings versus drawing power from the grid
- 🔋 Battery state of charge if you have a backup storage system
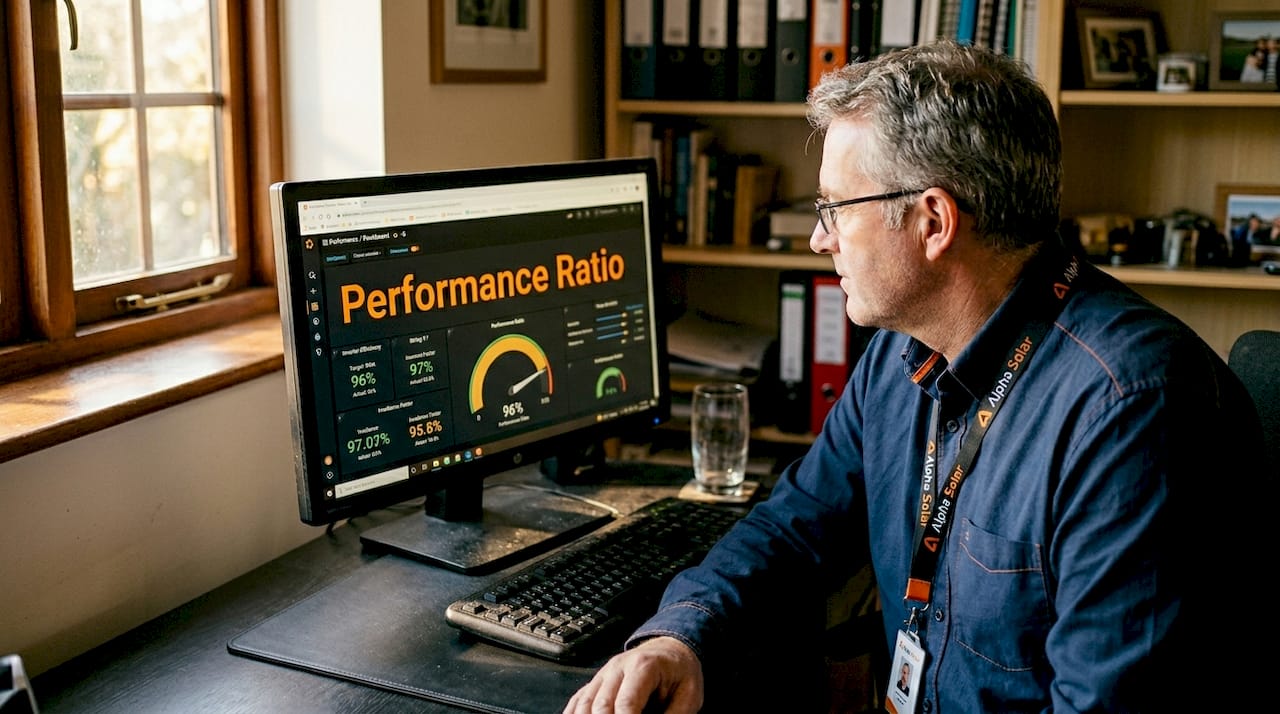
One of the most powerful numbers your dashboard will show is the performance ratio, often called PR. PR benchmarks efficiency by comparing how much electricity your system actually produces against the theoretical maximum it should produce given the sunlight available. A PR of 80% means your system is converting 80 cents of every dollar’s worth of available solar energy into usable electricity. Anything significantly below that is worth investigating.
Pro Tip: Check your performance ratio at least once a month. A steady PR means your system is healthy. A PR that slowly slides downward over several months is a signal that something is robbing you of production, even if your bills haven’t spiked yet.
Why monitoring matters for San Antonio homeowners
Understanding the basics is helpful, but it’s the benefits that can make a tangible impact on your energy bills and solar investment.
San Antonio gets an average of about 220 sunny days per year, which puts your solar system in a strong position to generate consistent power. But that same sun also brings intense heat, dust storms, and occasional hail, all of which can affect how well your panels perform. Monitoring ties directly into your ability to protect that production.
Here’s where PR becomes especially valuable. PR spots gradual declines in output that you simply cannot see by glancing at your bill each month. If your energy bill stays relatively flat but your production has quietly dropped 10 or 15%, you might just assume it’s a hot month. Monitoring tells you the real story.
For San Antonio homeowners focused on maximizing solar ROI, here’s what consistent monitoring delivers:
- Lower electricity bills: Catching a dropped panel string early means you restore full production instead of losing months of savings
- Longer system life: Identifying inverter stress, overheating, or connection problems before they cause permanent damage can add years to your system’s lifespan
- Stronger warranty claims: Monitoring logs give you documented evidence if equipment fails within its warranty period
- Incentive eligibility: Some utility programs and federal or state incentives require proof of production data. Your monitoring records are that proof.
- Better financial planning: When you know exactly what your system produces each month, you can make smarter decisions about adding battery storage or an EV charger
Statistic to know: Solar systems without active monitoring are estimated to lose between 10% and 25% of their potential annual output due to undetected faults, soiling, or shading issues. For a mid-size San Antonio home with a 10kW system, that could mean hundreds of dollars in avoidable losses every year.
Explore solar ROI strategies and solar system design examples to see how the right setup, combined with good monitoring, produces the best long-term financial outcomes.
Pro Tip: Always check your monitoring dashboard after a major storm, a utility outage, or any maintenance work on your roof. These events can knock panels loose, trip inverters, or cause connection issues that aren’t always obvious from the ground.
Common metrics and what they reveal
With clear benefits in mind, it’s important to understand the actual numbers you’ll encounter in a monitoring dashboard.
Most homeowners feel a little lost the first time they see a monitoring dashboard. Numbers, charts, and error codes can feel overwhelming. But once you know what each metric actually means, the dashboard becomes one of your most useful tools. Here’s a breakdown of the key metrics:
| Metric | What it measures | Why it matters |
|---|---|---|
| Performance ratio (PR) | Actual output vs. theoretical maximum | Overall system health and efficiency over time |
| System output (kWh) | Total electricity generated | Direct measure of energy savings and bill offset |
| Inverter efficiency | How well the inverter converts DC to AC power | Inverter health; low efficiency can signal imminent failure |
| Error and fault codes | Equipment alerts and communication errors | Prompt action before small issues become expensive repairs |
| Specific yield | kWh produced per kilowatt of installed capacity | Compares your system to regional benchmarks |
| Clipping losses | Energy lost when panels produce more than the inverter can handle | Signals the need for a system design review |
Performance ratio is a ratio comparing actual output to theoretical maximum, and tracking it over time is the single best way to detect gradual underperformance before it compounds into significant financial loss. A well-designed system in San Antonio should maintain a PR above 75 to 80% during summer months, with slight natural variations during extreme heat.
Check out net metering and metrics to understand how production data connects to your utility credits and overall billing.
Here are the key signs that it’s time to call your installer:
- Your PR drops more than 10% below your historical average without a weather explanation
- An inverter error code appears and doesn’t clear within 24 hours
- One string of panels consistently underproduces compared to neighboring strings
- Your system stops exporting power to the grid during peak sunlight hours
- You notice a steady month-over-month decline in kWh production across similar weather conditions
- Battery storage isn’t charging or discharging as expected
Spotting these trends early is what separates a solar system that pays for itself ahead of schedule from one that quietly underperforms for years.
Monitoring options: From DIY to pro solutions
Once you understand what to track, you’ll want to know how to choose the right monitoring solution for your needs.
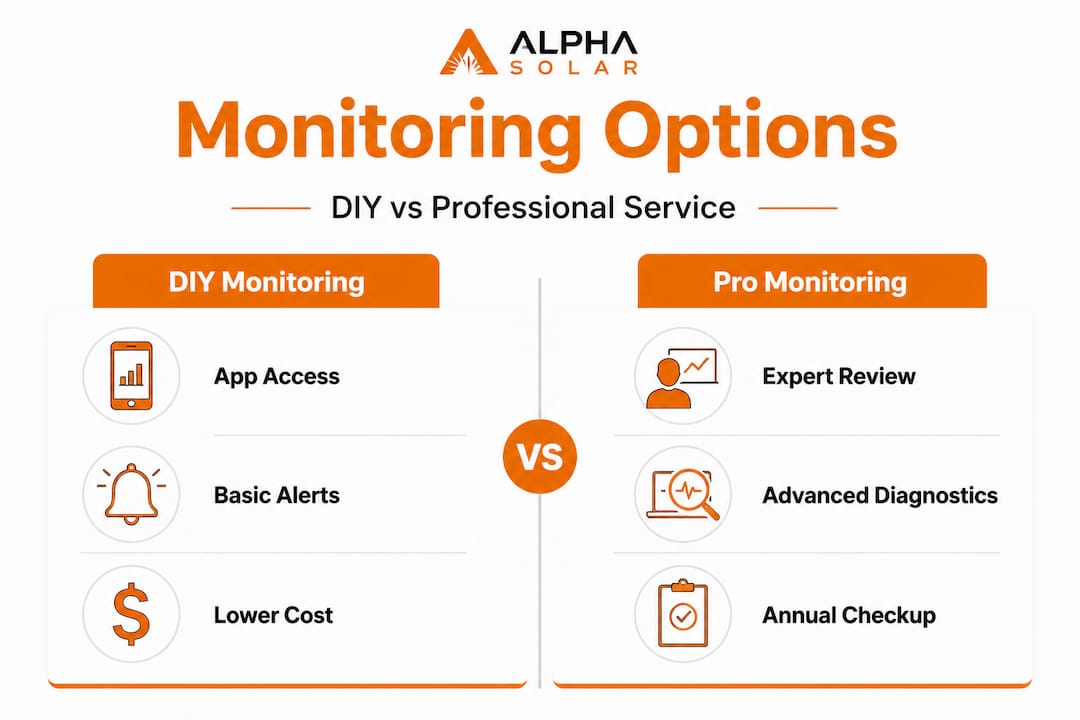
Not all monitoring systems are equal. The difference between basic app monitoring and full professional diagnostics is significant, especially for homeowners with larger systems or battery storage.
| Feature | DIY app monitoring | Professional monitoring service |
|---|---|---|
| Cost | Usually included with inverter | Monthly or annual fee |
| Data depth | Basic production and errors | Full diagnostics, panel-level data, alerts |
| Response time | You notice and act | Pro team notified and responds |
| Historical analysis | Limited | Detailed trending and reporting |
| Warranty documentation | Basic logs | Certified performance records |
| Ideal for | Smaller systems, tech-savvy owners | Any system size, hands-off owners |
Measuring beyond the inverter is essential for validating true system performance. Basic app monitoring only shows what the inverter reports, but a professional monitoring setup includes additional sensors and metering points that catch issues the inverter alone might miss.
Explore ROI of monitoring solutions to understand how professional monitoring pays for itself in recovered production and avoided repair costs.
If you already have panels installed and want to add or upgrade your monitoring, here’s how to get started:
- Audit your current setup: Check if your inverter already has built-in Wi-Fi monitoring and a companion app. Most modern inverters from brands like Enphase and SolarEdge do.
- Connect to your inverter’s platform: Download the manufacturer’s app, create an account, and follow the setup wizard to link your system.
- Install additional meters if needed: If you want to track whole-home energy consumption alongside solar production, you may need a separate energy meter at your electrical panel.
- Set up automated alerts: Configure notifications for production drops, fault codes, or communication outages so you don’t have to check manually every day.
- Consider a professional monitoring add-on: Ask your installer about third-party monitoring platforms that provide deeper analytics, historical comparisons, and professional response services.
Why proactive monitoring is non-negotiable for solar owners
As we’ve compared the options, let’s step back for some hard-won lessons from the field.
We’ve worked with a lot of San Antonio homeowners over the years, and the pattern is remarkably consistent. Homeowners who actively monitor their systems catch problems faster, maintain higher production levels, and get more money out of their investment over the life of the system. Those who treat solar as “set it and forget it” almost always leave value on the table.
Here’s the uncomfortable truth: solar panels are durable, but they are not maintenance-free. Dust accumulation in San Antonio’s dry, dusty summers can reduce output by 5 to 10% on its own. Add a partially shaded panel, a communication error in an inverter, or a loose connection from a roofing contractor working nearby, and you could be losing 15 to 20% of your expected production without a single visible warning sign.
“Performance ratio serves as a ratio comparing actual output to theoretical maximum, and consistent tracking is the most reliable method to spot gradual declines before they become serious financial problems.”
Small issues compound. A minor inverter communication error today becomes an undetected string failure next month. A few percent of shading loss this season becomes a degradation trend that skews your production expectations for years. The solar system that looked like a great investment at installation quietly becomes a mediocre one because no one was watching closely enough.
Our advice is direct: budget for an annual professional checkup even if you have a fully automated monitoring dashboard. Automated systems are excellent at catching sudden faults, but they aren’t always calibrated to notice the kind of slow, creeping efficiency loss that costs you the most money over time. A trained eye reviewing your year-over-year production data is still one of the most valuable things you can invest in.
Read real outcomes from homeowners who prioritized this approach in our real ROI stories to see what proactive monitoring looks like in practice.
Pro Tip: Even if your inverter app shows “system operating normally,” run a manual comparison of this month’s production against the same month last year. If you’re producing 10% less under similar weather, something has changed and it’s worth a call.
Ready to optimize your solar investment?
Armed with new insight, here’s how you can take the next step toward unlocking the full value of your solar system.
At Alpha Solar Solutions, we don’t just install solar and hand you the keys. We design systems that are built to perform and set up for easy monitoring from day one. Whether you’re starting fresh with residential solar installation or want to improve the performance of an existing system, we can help you get there.
Regular solar panel cleaning is one of the simplest ways to maintain your performance ratio and protect your savings throughout San Antonio’s dusty seasons. Combined with ongoing monitoring and periodic professional reviews, clean panels can make a measurable difference on your annual production numbers. Ready to get the most from what you’ve already invested? We’re here to help you maximize your solar ROI every step of the way. Contact us today to schedule a system review or talk through monitoring options that fit your setup.
Frequently asked questions
What does solar system monitoring track?
Solar system monitoring tracks energy production, system efficiency, and alerts you to faults or underperformance. It also benchmarks efficiency with PR, showing how effectively your system converts available sunlight into usable electricity.
How often should I check my solar monitoring dashboard?
You should check it monthly and after major weather events to catch changes in performance early. Consistent reviews help you spot trends before they turn into costly problems.
What is a good performance ratio (PR) for a solar system?
A strong performance ratio is typically above 80%, but consistently lower values signal possible issues. PR tracks performance over time and helps you detect declines before they significantly impact your savings.
Can I monitor my solar system on my phone?
Yes, most modern solar inverters and monitoring solutions offer mobile apps for real-time updates. Brands like Enphase and SolarEdge have user-friendly platforms that send alerts directly to your device.
Does monitoring help with warranty or incentive claims?
Monitoring provides documented evidence of system performance, which is often required for warranty or incentive claims. Having a clear production history strengthens your position significantly when filing any kind of claim with your equipment manufacturer or utility provider.